A polar axes uses spoke lines and circles to describe a polar coordinate system where points are represented by a radius and angle. This class draws a polar axes and has options to customize spokes and circles. More...
Classes | |
| class | ImaginaryTick |
| class | RealTick |
Public Member Functions | |
| RealTick | AddRealTick (double value) |
| ImaginaryTick | AddImaginaryTick (double value) |
| Coordinates | GetCoordinates (double radius, Angle angle) |
| Return the X/Y position of a point defined in polar space. | |
| Coordinates | GetCoordinates (PolarCoordinates point) |
| Return the X/Y position of a point defined in polar space. | |
| Coordinates | GetCoordinates (double resistance, double reactance) |
| Return the X/Y position of the given impedance. | |
| AxisLimits | GetAxisLimits () |
| Return the 2D area (in coordinate space) occupied by the data contained in this plottable. | |
| virtual void | UpdateAxisLimits (Plot plot) |
| virtual void | Render (RenderPack rp) |
| Draw the data from this plottable into the data area defined in the Axes. By default the surface is already clipped to the data area, but this can be cleared inside the plottable. | |
Static Public Member Functions | |
| static Coordinates | CalculateGamma (Coordinates normalizedImpedance) |
| static IEnumerable< Coordinates > | FindIntersectionPoints (Coordinates pt1, double r1, Coordinates pt2, double r2) |
Properties | |
| bool | IsVisible = true [get, set] |
| Toggles whether this plottable is shown and contributes to the automatic axis limit detection. The calling method will check this variable (it does not need to be checked inside the Render method). | |
| IAxes | Axes = new Axes() [get, set] |
| This object performs coordinate/pixel translation at render time based on the latest data area. It stores the axes to use for this plottable and also the data area (in pixels) updated just before each render. If this object is null it will be constructed using the default X and Y axes at render time. | |
| IEnumerable< LegendItem > | LegendItems [get] |
| Items which will appear in the legend. | |
| List< RealTick > | RealTicks = [] [get] |
| Concentric circular tick lines. | |
| List< ImaginaryTick > | ImaginaryTicks = [] [get] |
| Curves extending from the right side of the outer circle to various points around its circumference. | |
| Angle | Rotation = Angle.FromDegrees(0) [get, set] |
| Rotates the axis clockwise from its default position (where 0 points right) | |
| bool | ManageAxisLimits = true [get, set] |
| Enable this to modify the axis limits at render time to achieve "square axes" where the units/px values are equal for horizontal and vertical axes, allowing circles to always appear as circles instead of ellipses. | |
| LineStyle | RealLineStyle [get, set] |
| Default style of the curved lines extending from the right edge to points around the circumference of the chart outline. | |
| LineStyle | Imaginary [get, set] |
| Default style of the concentric circular axis lines. | |
| LabelStyle | LabelStyle = new() [get] |
| string? | LabelText = null [get, set] |
| double | LabelPaddingFraction = 0.1 [get, set] |
| Distance to offset label text. | |
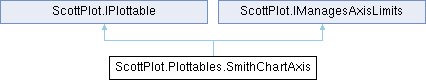
 Properties inherited from ScottPlot.IPlottable Properties inherited from ScottPlot.IPlottable | |
| Properties inherited from ScottPlot.IManagesAxisLimits | |
Detailed Description
A polar axes uses spoke lines and circles to describe a polar coordinate system where points are represented by a radius and angle. This class draws a polar axes and has options to customize spokes and circles.
Member Function Documentation
◆ AddImaginaryTick()
|
inline |
◆ AddRealTick()
|
inline |
◆ CalculateGamma()
|
inlinestatic |
◆ FindIntersectionPoints()
|
inlinestatic |
◆ GetAxisLimits()
|
inline |
Return the 2D area (in coordinate space) occupied by the data contained in this plottable.
Implements ScottPlot.IPlottable.
◆ GetCoordinates() [1/3]
|
inline |
Return the X/Y position of a point defined in polar space.
◆ GetCoordinates() [2/3]
|
inline |
Return the X/Y position of the given impedance.
◆ GetCoordinates() [3/3]
|
inline |
Return the X/Y position of a point defined in polar space.
◆ Render()
|
inlinevirtual |
Draw the data from this plottable into the data area defined in the Axes. By default the surface is already clipped to the data area, but this can be cleared inside the plottable.
Implements ScottPlot.IPlottable.
◆ UpdateAxisLimits()
|
inlinevirtual |
Implements ScottPlot.IManagesAxisLimits.
Property Documentation
◆ Axes
This object performs coordinate/pixel translation at render time based on the latest data area. It stores the axes to use for this plottable and also the data area (in pixels) updated just before each render. If this object is null it will be constructed using the default X and Y axes at render time.
Implements ScottPlot.IPlottable.
◆ Imaginary
|
getset |
Default style of the concentric circular axis lines.
◆ ImaginaryTicks
|
get |
Curves extending from the right side of the outer circle to various points around its circumference.
◆ IsVisible
|
getset |
Toggles whether this plottable is shown and contributes to the automatic axis limit detection. The calling method will check this variable (it does not need to be checked inside the Render method).
Implements ScottPlot.IPlottable.
◆ LabelPaddingFraction
|
getset |
Distance to offset label text.
◆ LabelStyle
|
get |
◆ LabelText
|
getset |
◆ LegendItems
|
get |
Items which will appear in the legend.
Implements ScottPlot.IPlottable.
◆ ManageAxisLimits
|
getset |
Enable this to modify the axis limits at render time to achieve "square axes" where the units/px values are equal for horizontal and vertical axes, allowing circles to always appear as circles instead of ellipses.
Implements ScottPlot.IManagesAxisLimits.
◆ RealLineStyle
|
getset |
Default style of the curved lines extending from the right edge to points around the circumference of the chart outline.
◆ RealTicks
|
get |
Concentric circular tick lines.
◆ Rotation
|
getset |
Rotates the axis clockwise from its default position (where 0 points right)
The documentation for this class was generated from the following file:
- ScottPlot/src/ScottPlot5/ScottPlot5/Plottables/SmithChartAxis.cs