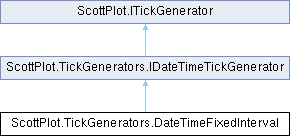
Public Member Functions | |
| DateTimeFixedInterval (ITimeUnit interval, int intervalsPerTick=1, ITimeUnit? minorInterval=null, int minorIntervalsPerTick=1, Func< DateTime, DateTime >? getIntervalStartFunc=null) | |
| Creates a new DateTimeFixedInterval generator. | |
| IEnumerable< double > | ConvertToCoordinateSpace (IEnumerable< DateTime > dates) |
| void | Regenerate (CoordinateRange range, Edge edge, PixelLength size, SKPaint paint, LabelStyle labelStyle) |
| Generate ticks based on the current settings and store the result in Ticks | |
Properties | |
| ITimeUnit | Interval [get, set] |
| The time unit to use for major ticks. | |
| int | IntervalsPerTick [get, set] |
| The number of Interval units between major ticks (e.g. major ticks every 7 Days) | |
| ITimeUnit? | MinorInterval [get, set] |
| The time unit to use for minor ticks. If null, no minor ticks are generated. | |
| int | MinorIntervalsPerTick [get, set] |
| The number of MinorInterval units between minor ticks. | |
| Func< DateTime, DateTime >? | GetIntervalStartFunc [get, set] |
| An optional function to override where the intervals for ticks start. The DateTime argument provided is the start range of the axis (i.e. IAxis.Min). | |
| Func< DateTime, string >? | LabelFormatter = null [get, set] |
| If assigned, this function will be used to create tick labels. | |
| Tick[] | Ticks = Array.Empty<Tick>() [get, set] |
| Ticks to display the next time the axis is rendered. This array and its contents should not be modified directly. Call Regenerate() to update this array. | |
| int | MaxTickCount = 10_000 [get, set] |
| Do not generate more than this number of ticks. | |
 Properties inherited from ScottPlot.ITickGenerator Properties inherited from ScottPlot.ITickGenerator | |
Constructor & Destructor Documentation
◆ DateTimeFixedInterval()
|
inline |
Creates a new DateTimeFixedInterval generator.
- Parameters
-
interval The time unit to use for major ticks intervalsPerTick The number of Interval units between major ticks minorInterval The time unit to use for minor ticks. If null, no minor ticks are generated. minorIntervalsPerTick The number of MinorInterval units between minor ticks. getIntervalStartFunc An optional function to override where the intervals for ticks start. The DateTime argument provided is the start range of the axis (i.e. IAxis.Min).
Member Function Documentation
◆ ConvertToCoordinateSpace()
|
inline |
Implements ScottPlot.TickGenerators.IDateTimeTickGenerator.
◆ Regenerate()
|
inline |
Generate ticks based on the current settings and store the result in Ticks
Implements ScottPlot.ITickGenerator.
Property Documentation
◆ GetIntervalStartFunc
|
getset |
An optional function to override where the intervals for ticks start. The DateTime argument provided is the start range of the axis (i.e. IAxis.Min).
If omitted, the ticks will start from IAxis.Min. This may have undesirable effects when zooming and panning. If provided, the ticks will start from the returned DateTime.
If the plot contains weekly data, and it is desired to have ticks on the 1st of each month:
If the plot contains hourly data, and it is desired to have ticks every 6 hours at 00:00, 6:00, 12:00, etc, then set Interval to Hour, IntervalsPerTick to 6, and provide the function:
◆ Interval
|
getset |
The time unit to use for major ticks.
◆ IntervalsPerTick
|
getset |
The number of Interval units between major ticks (e.g. major ticks every 7 Days)
◆ LabelFormatter
|
getset |
If assigned, this function will be used to create tick labels.
◆ MaxTickCount
|
getset |
Do not generate more than this number of ticks.
Implements ScottPlot.ITickGenerator.
◆ MinorInterval
|
getset |
The time unit to use for minor ticks. If null, no minor ticks are generated.
◆ MinorIntervalsPerTick
|
getset |
The number of MinorInterval units between minor ticks.
◆ Ticks
Ticks to display the next time the axis is rendered. This array and its contents should not be modified directly. Call Regenerate() to update this array.
Implements ScottPlot.ITickGenerator.
The documentation for this class was generated from the following file:
- ScottPlot/src/ScottPlot5/ScottPlot5/TickGenerators/DateTimeFixedInterval.cs