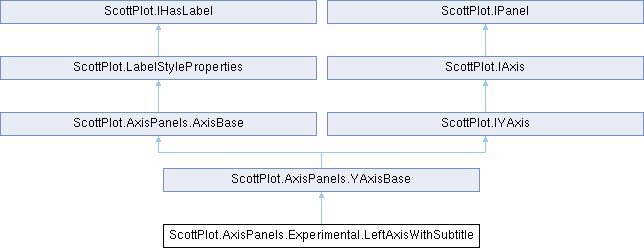
A simple custom Y axis which includes a subtitle/sub-label. Note that Measure and Render are called whenever the plot needs to be rendered so be wary of heavy code that will slow down the rendering if you are using the chart in a user interface where there is zooming, panning, etc.
More...
|
| | LeftAxisWithSubtitle () |
| |
| override float | Measure () |
| | Return the size (in pixels) of the panel in the dimension perpendicular to the edge it lays on.
|
| |
| override void | Render (RenderPack rp, float size, float offset) |
| | Draw this panel on a canvas.
|
| |
| float | GetPixel (double position, PixelRect dataArea) |
| | Get the pixel position of a coordinate given the location and size of the data area.
|
| |
| double | GetCoordinate (float pixel, PixelRect dataArea) |
| | Get the coordinate of a pixel position given the location and size of the data area.
|
| |
| PixelRect | GetPanelRect (PixelRect dataRect, float size, float offset) |
| | Return the rectangle for this panel.
|
| |
| double | GetPixelDistance (double distance, PixelRect dataArea) |
| | Given a distance in coordinate space, converts to pixel space.
|
| |
| double | GetCoordinateDistance (float distance, PixelRect dataArea) |
| | Given a distance in pixel space, converts to coordinate space.
|
| |
| void | RegenerateTicks (PixelLength size) |
| | Use the TickLabelStyle to generate ticks with ideal spacing.
|
| |
| override string | ToString () |
| |
| void | Color (Color color) |
| | Apply a single color to all axis components: label, tick labels, tick marks, and frame.
|
| |
| void | SetTicks (double[] xs, string[] labels) |
| | Replace the TickGenerator with a NumericManual pre-loaded with the given ticks.
|
| |
| void | SetTicks (double[] xs, string[] labels) |
| | Replace the TickGenerator with a NumericManual pre-loaded with the given ticks.
|
| |
|
| string | SubLabelText [get, set] |
| |
| LabelStyle | SubLabelStyle = new() { Rotation = -90, } [get, set] |
| |
| override Edge | Edge [get] |
| | Indicates which edge of the data rectangle this panel lays on.
|
| |
| double | Height [get] |
| |
| bool | IsVisible = true [get, set] |
| |
| Edge | Edge [get] |
| |
| virtual CoordinateRangeMutable | Range = CoordinateRangeMutable.NotSet [get] |
| |
| float | MinimumSize = 0 [get, set] |
| |
| float | MaximumSize = float.MaxValue [get, set] |
| |
| float | SizeWhenNoData = 15 [get, set] |
| |
| PixelPadding | EmptyLabelPadding = new(10, 5) [get, set] |
| |
| PixelPadding | PaddingBetweenTickAndAxisLabels = new(5, 3) [get, set] |
| |
| PixelPadding | PaddingOutsideAxisLabels = new(2, 2) [get, set] |
| |
| bool | ClipLabel = false [get, set] |
| | Controls whether labels should be clipped to the boundaries of the data area.
|
| |
| double | Min [get, set] |
| |
| double | Max [get, set] |
| |
| virtual ITickGenerator | TickGenerator = null! [get, set] |
| |
| LabelStyle | Label [get] |
| |
| override LabelStyle | LabelStyle [get, set] |
| |
| bool | ShowDebugInformation = false [get, set] |
| |
| LineStyle | FrameLineStyle [get] |
| |
| TickMarkStyle | MajorTickStyle [get, set] |
| |
| TickMarkStyle | MinorTickStyle [get, set] |
| |
| LabelStyle | TickLabelStyle [get, set] |
| |
| LabelStyle | LabelStyle [get, set] |
| |
| float | LabelOffsetX [get, set] |
| |
| float | LabelOffsetY [get, set] |
| |
| float | LabelRotation [get, set] |
| |
| float | LabelPadding [set] |
| |
| PixelPadding | LabelPixelPadding [get, set] |
| |
| PixelRect | LabelLastRenderPixelRect [get] |
| |
| string | LabelText [get, set] |
| |
| Alignment | LabelAlignment [get, set] |
| |
| string | LabelFontName [get, set] |
| |
| float | LabelFontSize [get, set] |
| |
| float? | LabelLineSpacing [get, set] |
| |
| bool | LabelItalic [get, set] |
| |
| bool | LabelBold [get, set] |
| |
| Color | LabelFontColor [get, set] |
| |
| Color | LabelBackgroundColor [get, set] |
| |
| float | LabelBorderRadius [get, set] |
| |
| float | LabelBorderRadiusX [get, set] |
| |
| float | LabelBorderRadiusY [get, set] |
| |
| float | LabelBorderWidth [get, set] |
| |
| Color | LabelBorderColor [get, set] |
| |
| Color | LabelShadowColor [get, set] |
| |
| PixelOffset | LabelShadowOffset [get, set] |
| |
| CoordinateRangeMutable | Range [get] |
| | Min/Max range currently displayed by this axis.
|
| |
| double | Min [get, set] |
| |
| double | Max [get, set] |
| |
| ITickGenerator | TickGenerator [get, set] |
| | Logic for determining tick positions and formatting tick labels.
|
| |
| LabelStyle | Label [get] |
| | The label is the text displayed distal to the ticks.
|
| |
| TickMarkStyle | MajorTickStyle [get, set] |
| |
| TickMarkStyle | MinorTickStyle [get, set] |
| |
| LabelStyle | TickLabelStyle [get, set] |
| |
| LineStyle | FrameLineStyle [get] |
| |
| bool | IsVisible [get, set] |
| | If false, the panel will not be displayed or report any size.
|
| |
| float | MinimumSize [get, set] |
| | Disallow the panel to be smaller than this.
|
| |
| float | MaximumSize [get, set] |
| | Disallow the panel to be larger than this.
|
| |
| bool | ShowDebugInformation [get, set] |
| | Enable this to display extra information on the axis to facilitate development.
|
| |
A simple custom Y axis which includes a subtitle/sub-label. Note that Measure and Render are called whenever the plot needs to be rendered so be wary of heavy code that will slow down the rendering if you are using the chart in a user interface where there is zooming, panning, etc.
 Public Member Functions inherited from ScottPlot.AxisPanels.YAxisBase